Invaded Range
Lilah Shtino1
Matthew R. Helmus2
27 August 2026
Source:vignettes/invaded_range.Rmd
invaded_range.RmdCitation
Keller, J., S De Bona, & MR Helmus. Leveraging spatial scale and temporal variation to track the spread rate of invasive spotted lanternflies (Lycorma delicatula). NeoBiota, 106: 287-307. https://doi.org/10.3897/neobiota.106.177041
knitr::kable(sampling_effort())| | | 0% | |=========================================== | 61% | |============================================== | 66% | |=================================================================== | 96% | |======================================================================| 100%
| Biological Year | Number of presences | Number of presences with confirmed establishment | Number of absences | Invaded area (km²) | Invasion boundary length (km) | Sampling effort (Obs. per km² area) | Sampling effort (Obs. per km boundary) |
|---|---|---|---|---|---|---|---|
| 2014 | 84 | 36 | 326 | 38.9 | 27.6 | 10.5 | 14.9 |
| 2015 | 12689 | 8582 | 33756 | 272.2 | 77.0 | 170.6 | 603.2 |
| 2016 | 8953 | 7122 | 19706 | 1706.4 | 187.6 | 16.8 | 152.8 |
| 2017 | 3528 | 2807 | 11730 | 7233.0 | 401.4 | 2.1 | 38.0 |
| 2018 | 7445 | 5868 | 102945 | 16352.6 | 669.6 | 6.8 | 164.9 |
| 2019 | 11194 | 8050 | 124220 | 29391.7 | 1080.4 | 4.6 | 125.3 |
| 2020 | 9118 | 4422 | 57712 | 39837.1 | 1720.1 | 1.7 | 38.9 |
| 2021 | 11167 | 5540 | 54770 | 54451.1 | 2582.1 | 1.2 | 25.5 |
| 2022 | 14753 | 8175 | 58462 | 86886.2 | 3584.2 | 0.8 | 20.4 |
| 2023 | 18332 | 12313 | 54493 | 121495.4 | 4353.2 | 0.6 | 16.7 |
| 2024 | 16834 | 10007 | 50322 | 140571.7 | 5616.7 | 0.5 | 12.0 |
| 2025 | 11254 | 8770 | 33089 | 163333.2 | 7266.9 | 0.3 | 6.1 |
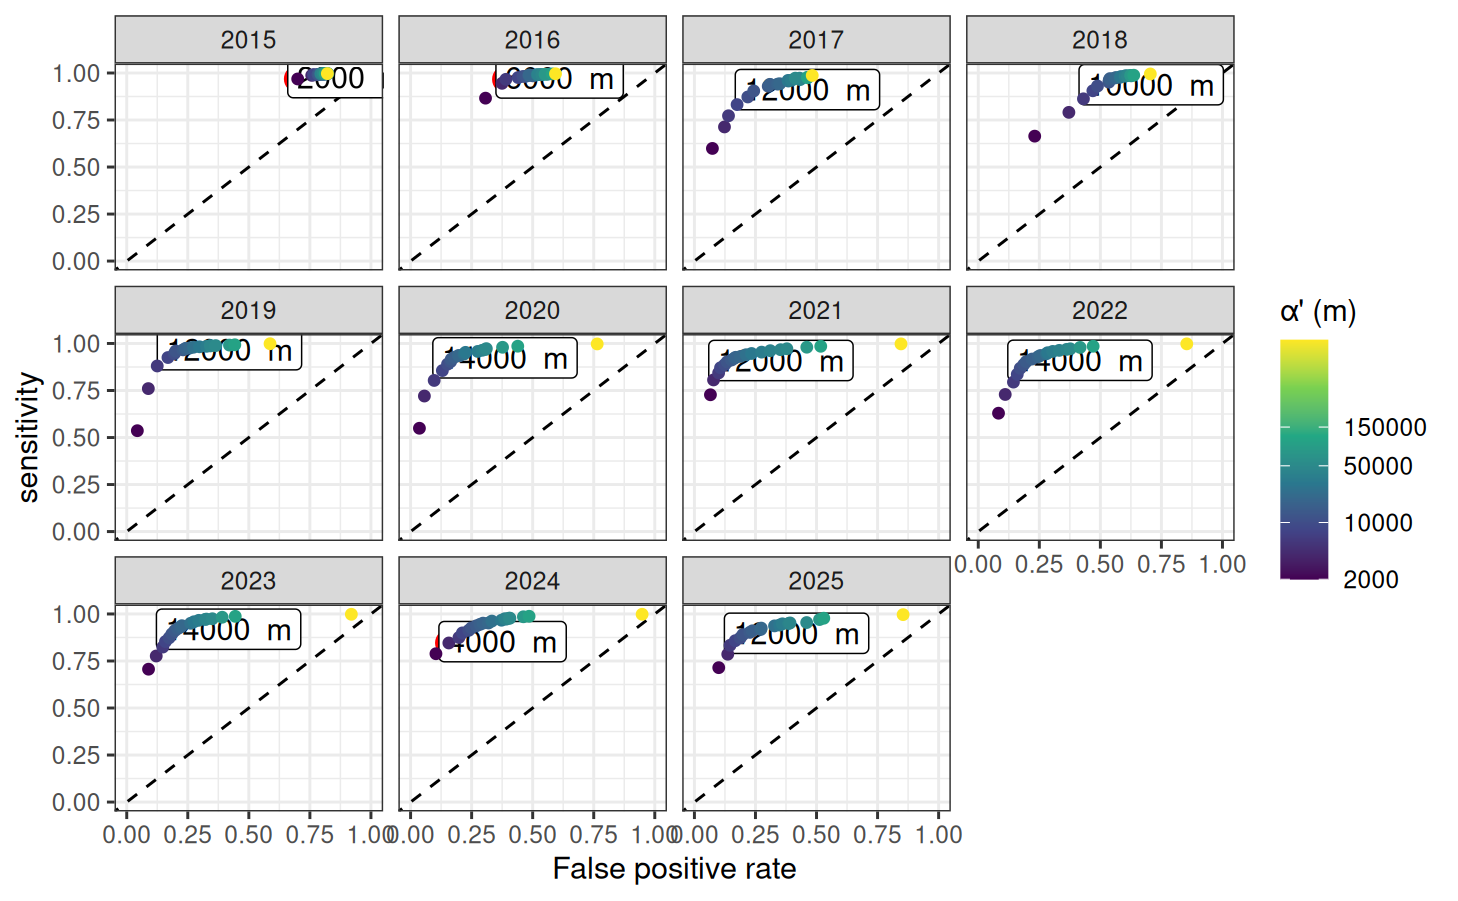
Scale selection for α hulls by Youden’s J
## [1] "Please be patient: the large dataset might cause the map to load slowly"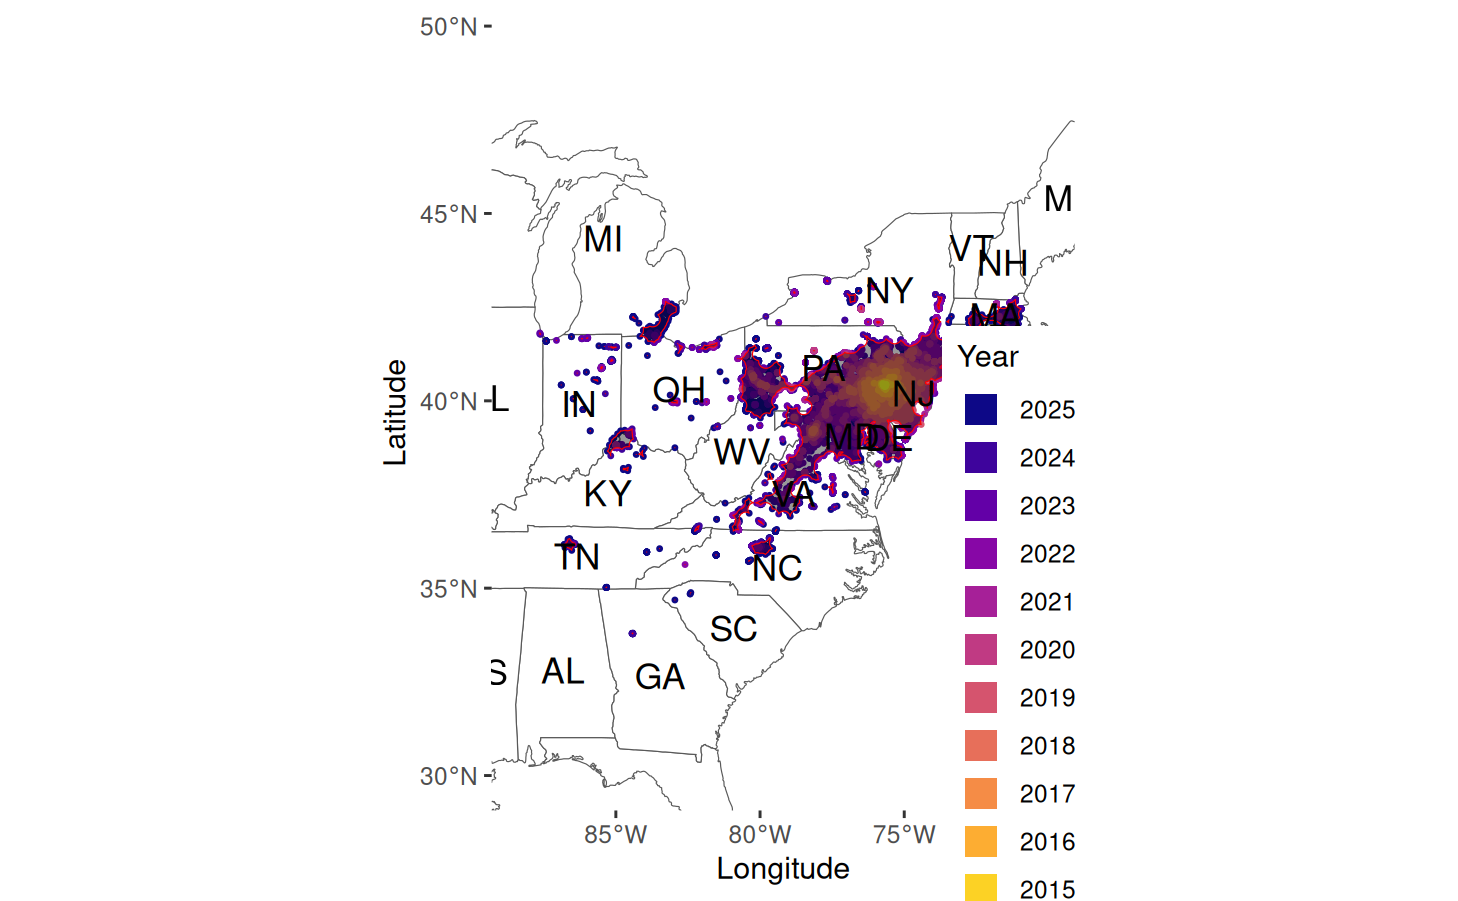
Output of the map_alphahull() function for the 2025
biological year
Temple University, lilah.shtino@temple.edu↩︎
Temple University, mrhelmus@temple.edu↩︎